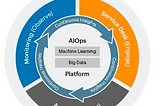
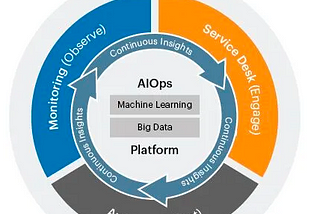
Deepak RaiWhat is AIOpsAIOps, short for Artificial Intelligence for IT Operations, is an approach that leverages artificial intelligence (AI) and machine learning…4 min read·Apr 20, 2024----
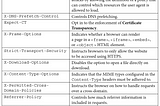
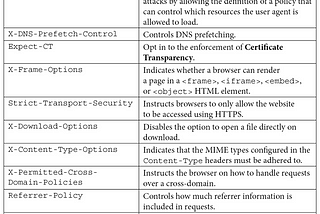
Deepak RaiArchitecting Cloud SecurityThere are 5 very important cloud security strategies which everyone should follow if they are using cloud service for their applications2 min read·May 12, 2022----
Deepak RaiCronjob For Databse Backup and Application Files BackupWe will discuss about writing cronjob for taking application folder backup as well as taking backup of database files/data. We have used…2 min read·Oct 3, 2021----
Deepak RaiDrag and Drop on CanvasThis article will help you to implement drag and drop features on canvas element. First of all we need one canvas element1 min read·Oct 2, 2021----
Deepak RaiCreating Pie Chart Using CanvasThis article will help you to create pie chart using canvas.We need first one canvas element.1 min read·Oct 2, 2021----